Residential market accounts for 80% of cranes in capital cities
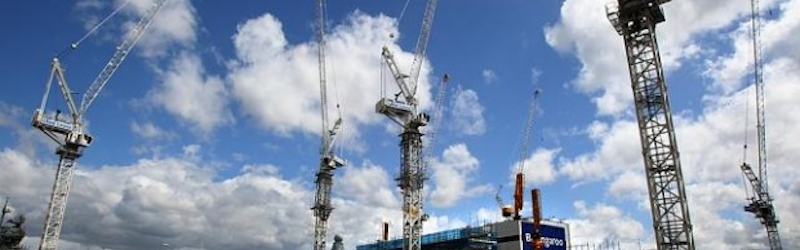
Populating the skyline of Australia's cities, the number of cranes observed in Australia have grown from 113 to 539. The continuing strength of the residential sector across Australia has seen an extra 117 cranes commence work on residential sites, representing an overall increase of 38 % more cranes. We shed light on the RLB's newly released Crane Index.
The report measures crane movements across Australia in the past six months, with the last publication released in April 2015.
According to the Q4 RLB Crane Index, 301 new tower cranes were erected across Australia’s skylines in the past six months, proving the construction industry is still undergoing significant growth. This count was offset by the removal of 188 cranes from sites around Australia, which are nearing completion.
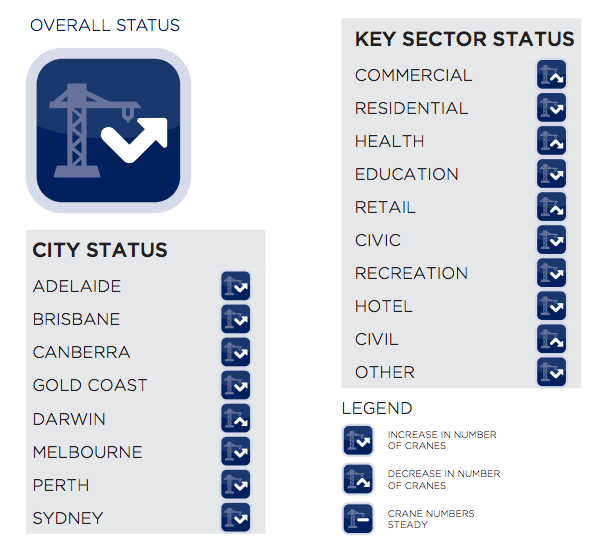
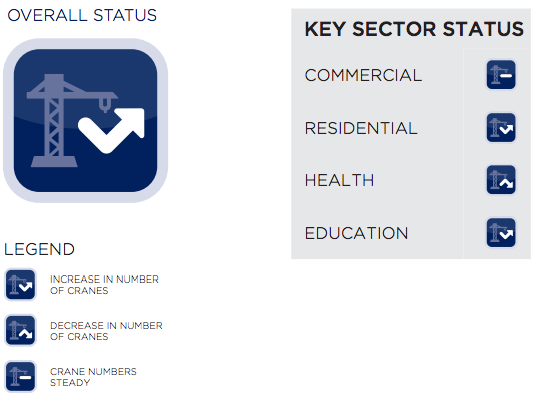
RLB director of research and development Stephen Ballesty commented, The Q4 2015 RLB Crane Index has identified a total of 539 cranes currently erected across Australia’s capital cities, a 26.5% increase in number since Q2 2015.
“Based on our research, 79.2% of all cranes erected across the country are on residential projects, while only 8.7% of the total number are erected on commercial projects. 65% of the residential cranes are located in Sydney and Melbourne. Cranes erected on the east coast of Australia amount to 89.4% of all cranes sighted in Australia.”
“The concentration of residential cranes within key cities identified within the RLB Crane Index is a testament to the inner-city housing challenges facing our key cities,” he said.
The Q4 2015 RLB Crane Index continues to highlight the positive sentiments of the construction industry. Activity is most buoyant in Sydney with 220 cranes erected and Melbourne with 136 cranes. These markets are followed by Brisbane (104 cranes), Perth (47 Cranes), Gold Coast (16), Adelaide (7 cranes), Darwin (3 cranes) and Canberra (6 cranes).
"Those of us in the building industry should all be very grateful that the market is doing what it's doing," said Brookfield Multiplex chief executive John Flecker, of the high proportion of residential work.
"I don't think, as an industry, it's catastrophic. These things do cycle and the other sectors will pick up. If all you did was residential and you grew substantially because there's a lot of work at the moment, you'd have to question how sustainable that was in the longer term, but if you're diversified, you should be fine."
 Sydney remains the construction king with the greatest number of cranes erected in the residential (170), commercial (18) and civic (15). Melbourne dominated the retail (6). The Gold Coast is showing a state of recovery with the addition of 8 cranes and removal of 7 cranes to total 16 cranes currently on the skyline.
The positive growth of crane numbers across the country, corresponds with the amount of construction work done. Significant increases in the volume of apartment construction is enabling the growth of cranes across the skyline of Australia.
Asian developers and foreign investors continue to flex their muscle in the residential development market with recent significant site acquisitions and developments underway in Brisbane, Melbourne and Sydney.
KEY FINDINGS
 Adelaide
- 7 cranes observed in total (up one crane since last index in April)
- educational sector represents 43% of all cranes currently in use
- residential and commercial projects account for 43% and 14% of all cranes respectively
- seeing consistent value of both residential and non-residential work being completed for the past six financial years but a considerable drop in the value has been seen in Engineering works (a fall of $1.9b from the high of 2012/13)
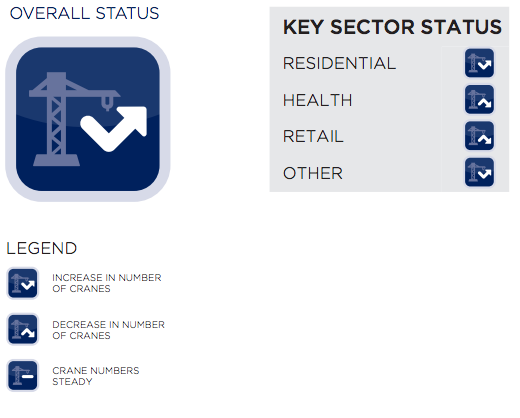
Brisbane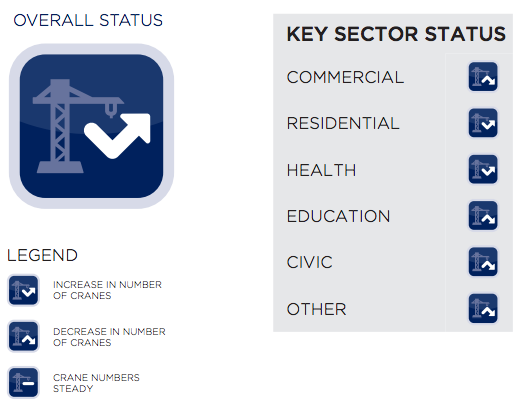
- 104 cranes observed in total (up 31 since last index), represents 42% increase compared to cranes observed in Q2
- 77 cranes erected and 46 removed since last index
- residential projects represent 90% of all cranes in Brisbane (apartment projects and multistorey residential projects)
- remaining 10% are on commercial and health projects)
- witnessed staggering 75 residential crane commencements over past six months, while 38 have been removed from sites around the city
Canberra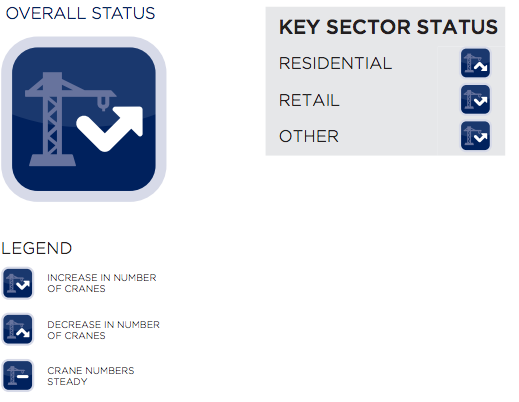
- 6 cranes observed in total (up 1 since last index)
- 66% of cranes currently erected in Canberra handle residential projects
- 43% of Canberra's cranes have been installed across three projects in Civic
- forecast dependency on residential work in ACT
- non-residential and Engineering sectors have fallen 76% and 26% respectively on the 2011/12 value of work done
Darwin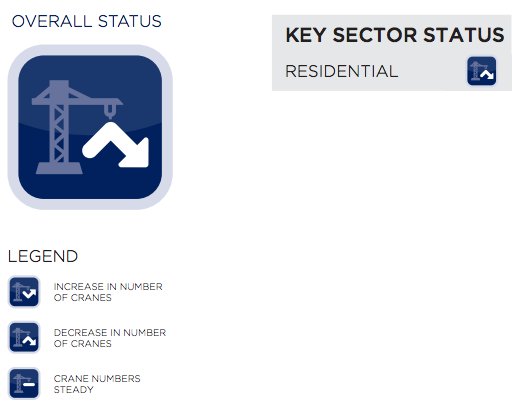
- 3 cranes observed in total (down 3 since last index)
- all cranes are assisting in the delivery of new residential accommodation
- residential and non-residential construction work done for the financial year 2014/15 was down 11% and 33% from the previous year
- engineering work done for financial year 2014/15 surged considerable due to significant works being undertaken on Blaydin Point and Wickham Point
Gold Coast
- 16 cranes observed in total (up 1 since last index)
- residential developments occupy 88% of cranes sighted on the Gold Coast, an increase of 56%
- growth in residential market has offset the reduction in cranes following the impending completion of both the Private Hospital in Southport and Pacific Fair in Broadbeach
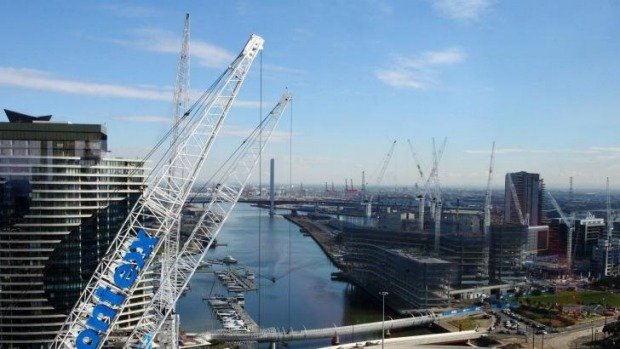
Melbourne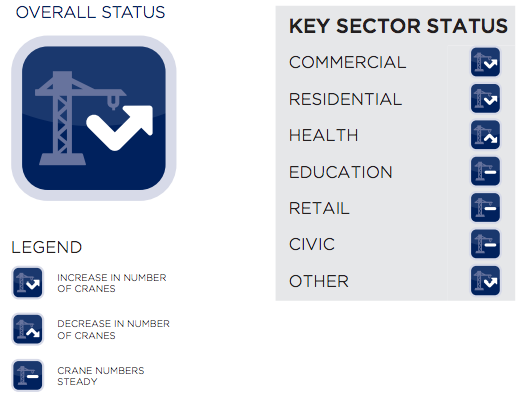
- 136 cranes observed in total (up 20 since last index), this 17% increase is reflective of residential construction market
- more than 80% of cranes are found on residential sites, up 75% from last count
- of 73 new cranes installed during past six months, new residential cranes represent 86% of all new cranes commencing on site
- significant increase in number of mid-rise and large scale residential infill developments
- 25% increase in commercial construction activity since Q2 with 15 commercial cranes now on site
- commercial cranes represent 11% of the total cranes in Melbourne, up 9.5% since Q2
- no cranes were installed on health projects during the period but seven were removed
- six cranes engaged in retail sector assisting the expansion of shopping centres at Chadstone and Eastland
- 53 cranes were removed throughout Melbourne in past six months, 41 from residential projects, four from commercial, seven from health and one from an education site
- 39% of all cranes can be found within CBD, Southbank and Docklands area
- Northern, Eastern, Southern and Western subrubs share the remaining 16%, 20%, 22% and 4% respectively.
- marginal rise in commencement of non-residential developments in last six months
- residential market to continue to be strong in foreseeable future
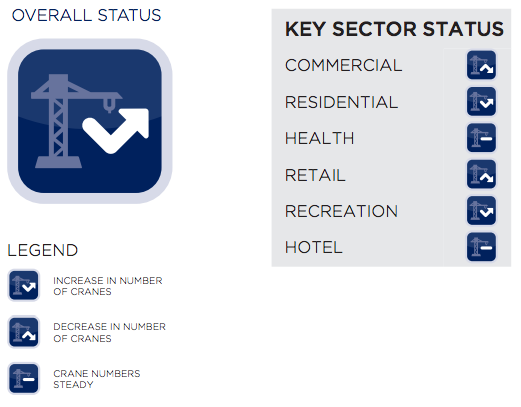 Perth
Perth
- 47 cranes observed (up 4 from last index)
- skyline transforming from commercial cranes to residential cranes
- 23 new cranes erected for commencement of new project, with 19 cranes removed from projects across Perth
- demand for commercial developments is waning (transition from mining construction phase to productivon phase), albeit offset by strong demand for residential accommodation
- engineering work done fell by $5b (10%) in 2014/15, non-residential construction fell 4%, residential construction work done increased by 8%
- 64% of all cranes are on residential projects, only 8% on commercial projects (previously 51% and 37% respectively)
- addition of 10 cranes with only two removals in residential sector highlight that 67% of cranes are continuations
- 15 commercial cranes, or 94% of previous count, were revmoed from sites during the period
- health sector has remained steady in crane count
- commencement of new Perth Stadium has seen eight cranes erected, accounting for 17% of total number of cranes in Perth
- hotel sector has remained steady since last count (4 observed)
Sydney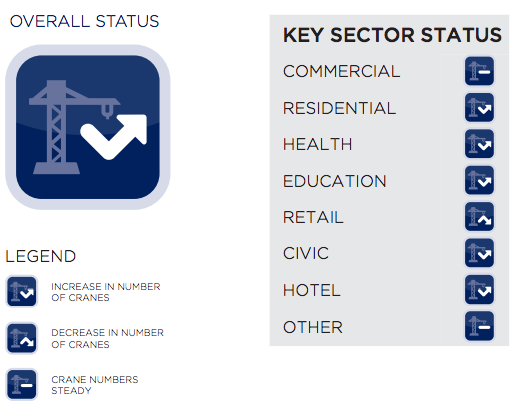
- 220 cranes observed (up 58 from last index)
- 97% of total cranes are found in Sydney metropolitan region
- 111 new cranes have been erected across Sydney
- 53 cranes removed from projects nearing completion since Q2
- growth in cranes highlights strengtehning volume of construction work undertaken
- ABS construction work done data for the financial year 2014/15 has seen an increase of 40% and 29% respectively for both the residential and non-residential sectors over the work performed in 2011/12
- over 77% of all cranes sighted are on residential projects, with 90 new cranes erected (continued growth of multi-level apartment residential sector across Sydney) and 43 removed
- increase of 1 crane in commercial sector reinforces positive sentiment (countered the 19% decrease in previos index)
- strong growth in health, education and civic sectors has seen an additional 9 cranes collectively commence
- cranes on health projects have doubled since last count, with 6 cranes now sitting on health projects
- four new cranes have been seen on education projects
- civic sector accounts for 7% of all cranes in Sydney
- retail sector declined by one crane during the period (from 4 to 3)
Construction professionals that understand the changing market are better equipped to provide value to their client. We know it’s time consuming to research this from scratch, so we’ve written a guide on the 7 Factors Affecting Plant Hire Rates. Download your eBook today by clicking below!


Recent Articles

New milestones marked for key 2032 Brisbane Olympic & Paralympic Games venues
The delivery of key 2032 Brisbane Olympic and Paralympic Games venues as well as generational infrastructure is steadily gaining momentum in just 12 months after the Queensland Government released the 2032 Delivery Plan.

Redevelopment of Macquarie Point Precinct in Hobart a step closer to reality
The Australian Government has accepted the Macquarie Point Precinct Master Plan and Housing Plan – two key plans that will ultimately revitalise Macquarie Point in Hobart, Tasmania.

Major repairs underway on QLD Gillies Range Road
Major reconstruction works on Gillies Range Road in Far North Queensland are now underway on sections that have been damaged by the Tropical Cyclone Jasper as well as the severe flooding that followed.