Procurement performance and vendor spend reports you should be pulling
Big data, small data, lots of data. What are we supposed to do with all this data? It can get overwhelming quickly. Many construction companies miss out on critical insights because they're managing procurement manually with excel and email.
But the good news is, if you are already collecting procurement related data, and confident about its quality, the next step is to start tracking key procurement metrics and build meaningful reports for relevant stakeholders.
In this post, let’s explore performance metrics for procurement activities as well as procurement dashboard examples for construction companies/projects.
Why do we need to analyse data?
Firstly, why bother? Procurement data analysis or analytics helps organisation answer questions such as “What happened?”, “Why did it happen?”, “What will happen?” and “What should we do?”.
In short, it helps organisations:
- Track performance internally (e.g. procurement team) and externally (e.g. subcontractors)
- Provide warnings that can result in early intervention or risk mitigation
- Improve budgeting and forecasting
- Leverage knowledge across different departments for future decision making
How procurement data analysis is done, what KPIs or metrics are used, can vary across different departments, job roles, stages of the project or vendor relationship lifecycle.
Here, we touch on a few common use cases and metrics, as well as example dashboards that you can set up for yourself or your teams.
Analysing project procurement performance: Pre-contracts, Project, Commercial
To keep construction projects running on schedule and budget, various stakeholders need to pull their weight. While pre-contract teams can get projects off to a good start by ensuring a smooth procurement process and handover, shared visibility at all times is what matters. It means at any point in time, project delivery can see what’s next, or commercial can see what’s left of the financial targets.
Here are a few reports that you can pull to answer questions related to progress, health and correlations.
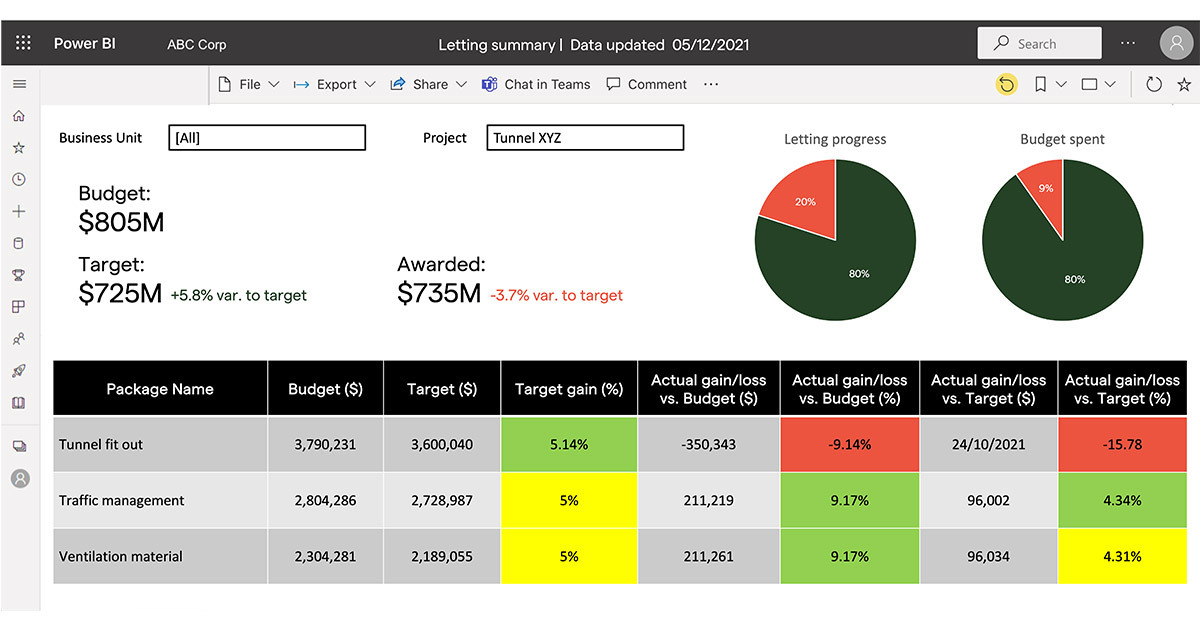
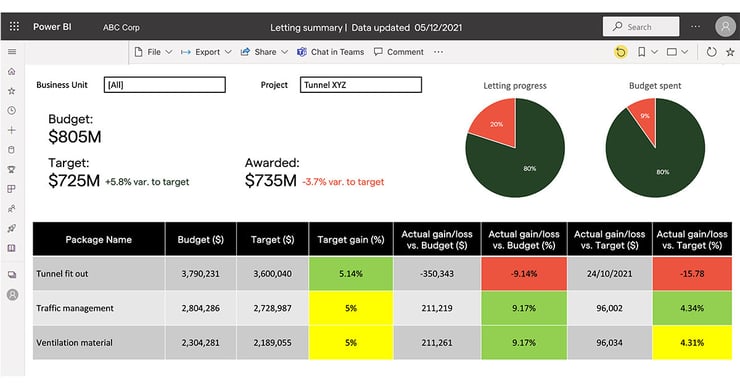
Overview – Listing
Purpose: Get a summary of everything at a glance
- List of projects
- List of packages per project
- List of packages and statuses
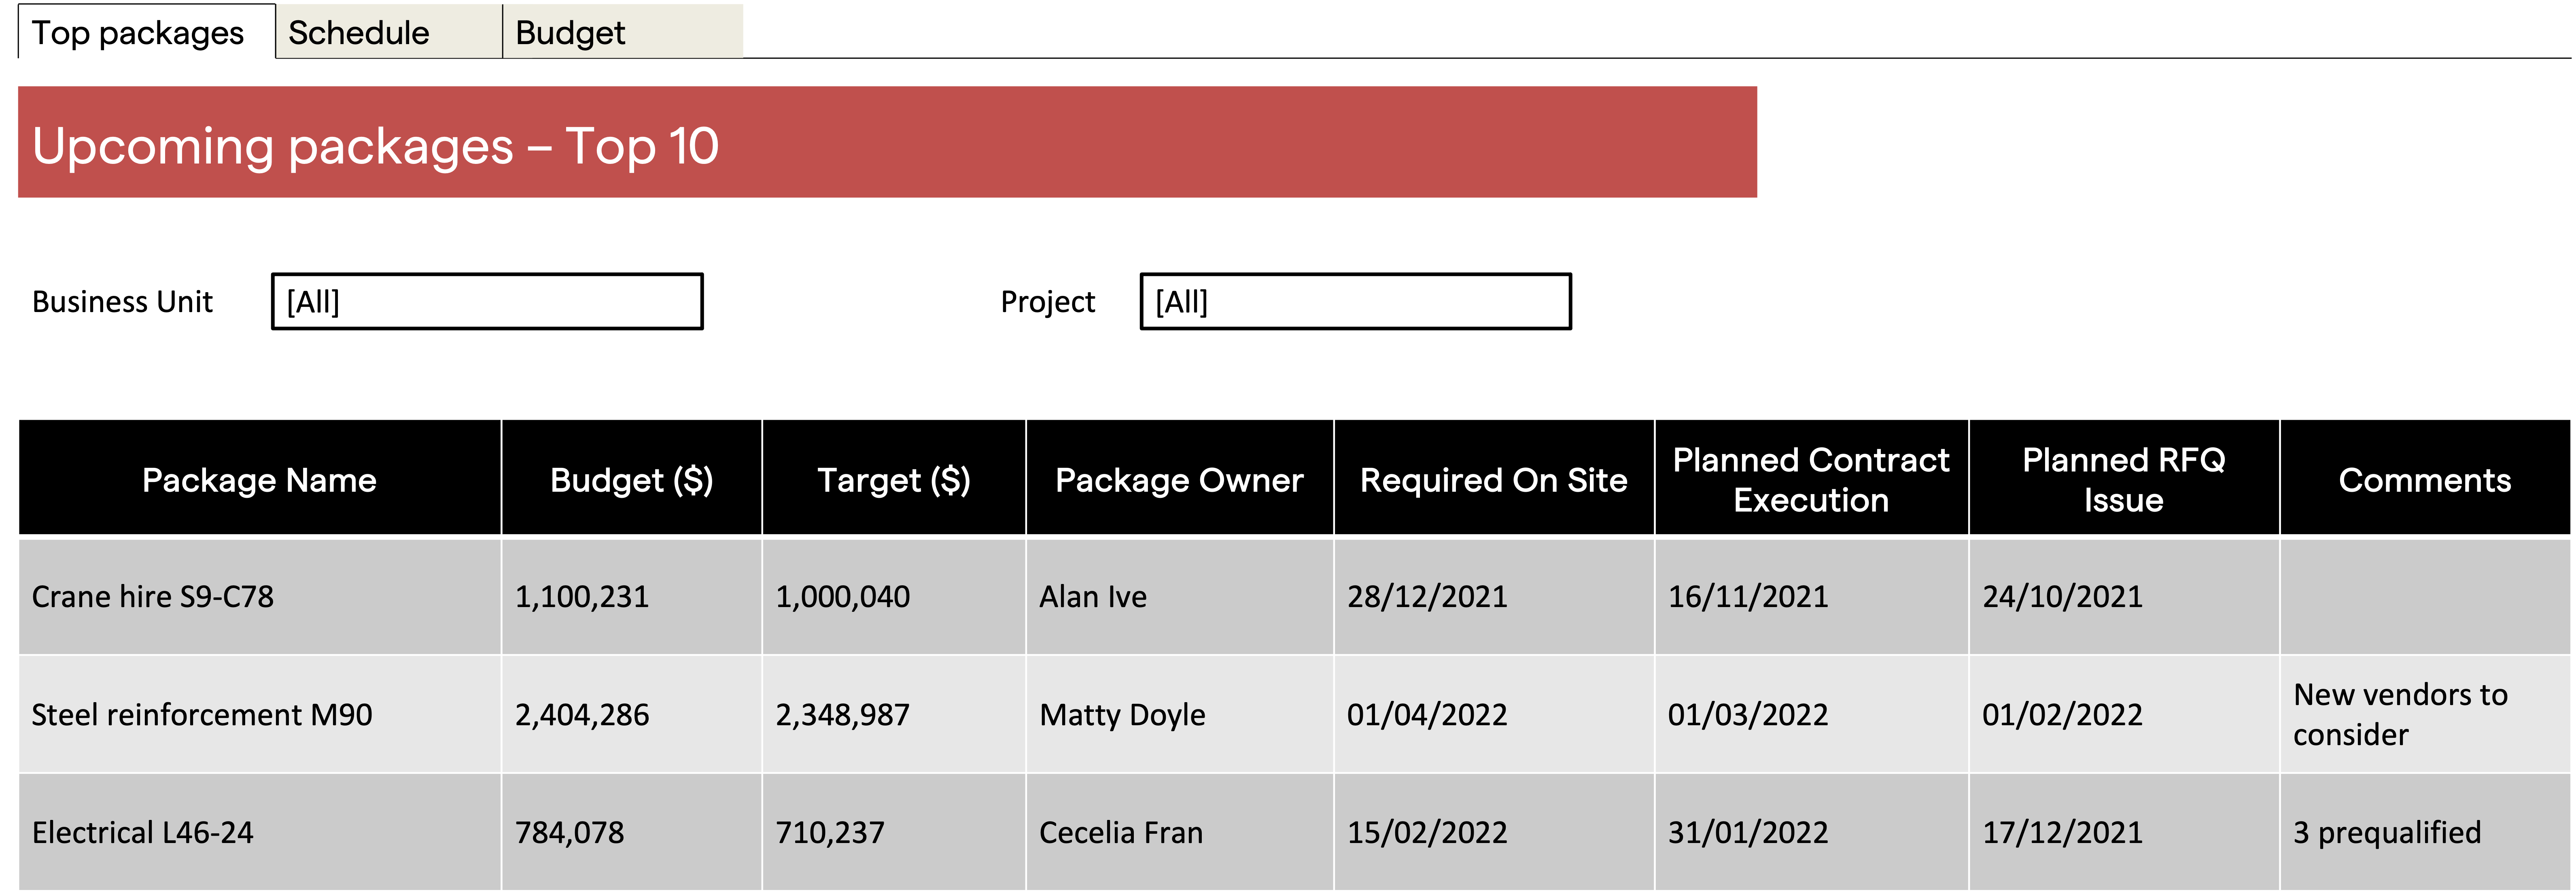
Prioritisation
Purpose: Help central procurement and commercial teams know where to focus efforts to assist projects in budget wins
-
Top 5 or 10 upcoming packages by value/ date across all projects
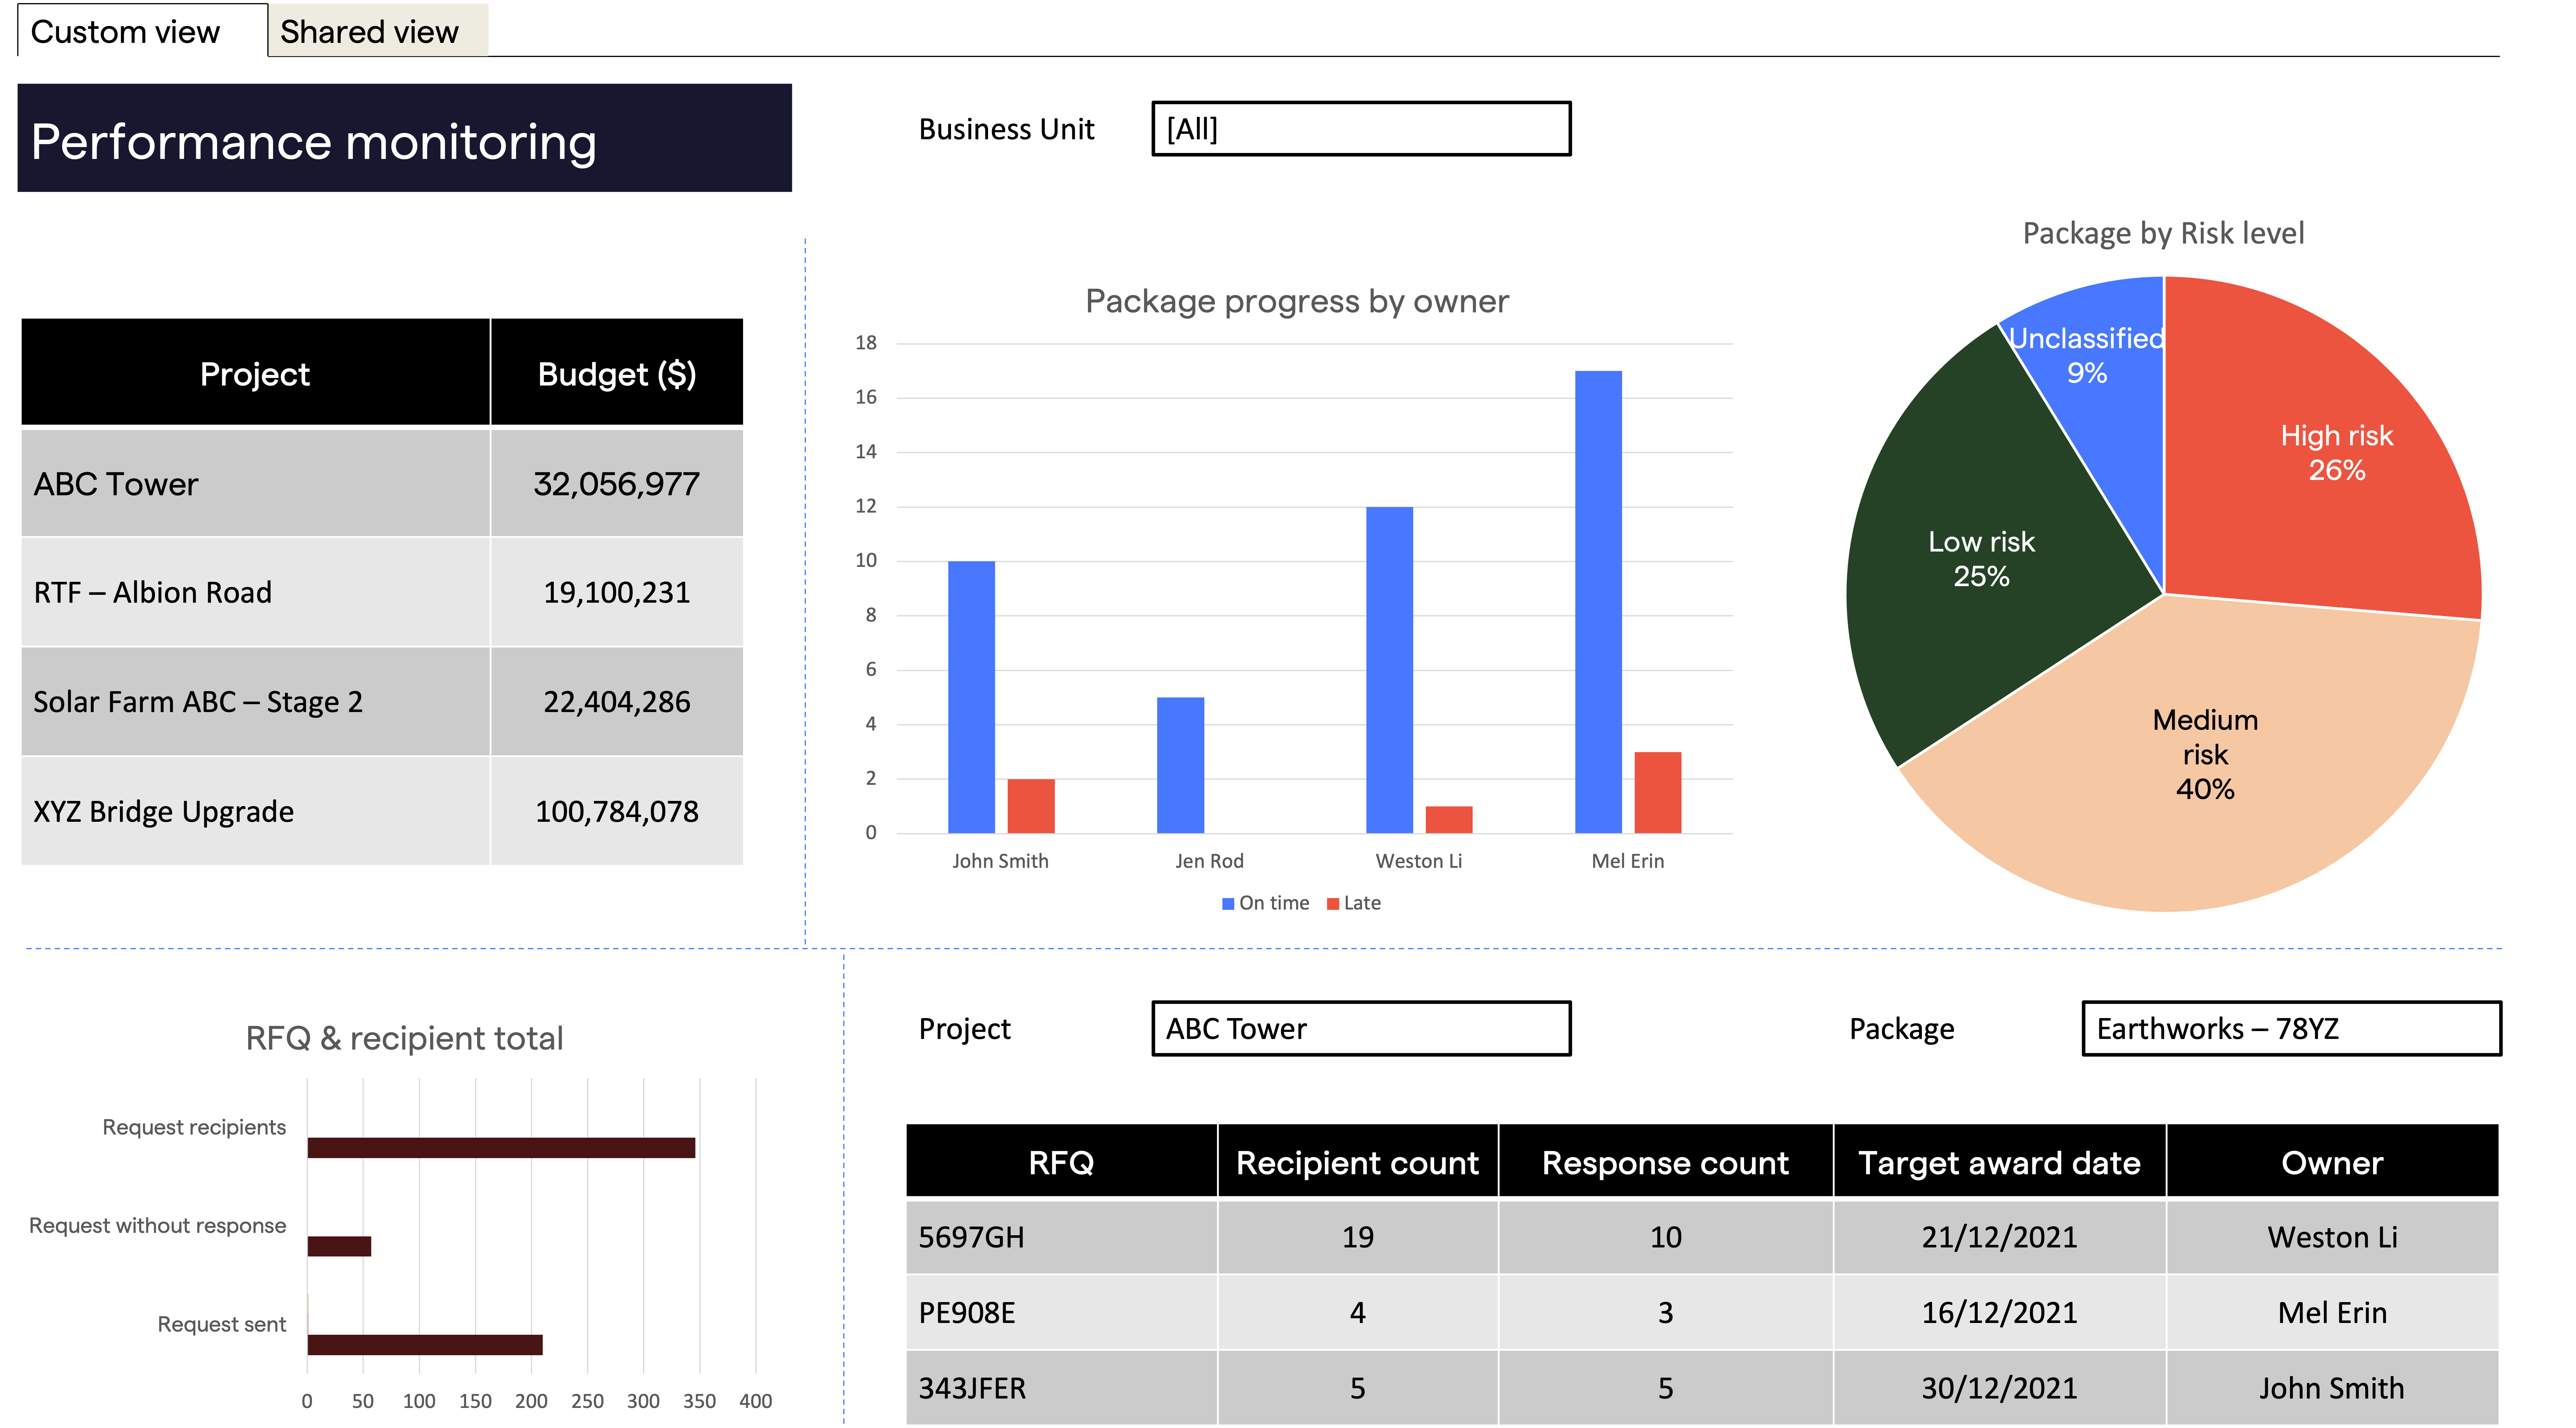
Slice and dice
Purpose: Analyse a certain dimension of interest to a particular stakeholder
- Total budget by project
- Package by risk level
- Response (bid) count by RFQ
- On-time package by owner
Gap analysis
Purpose: Track project health and identify risk mitigation strategies where necessary
- Variance to budget
- Total awarded contracts/packages vs project budget
- Variance to required on-site date (or any other date values such as “planned contract execution date, planned tender issue date)
Trends
Purpose: Identify patterns and opportunities for improvement or prioritisation
- Common packages over a time horizon
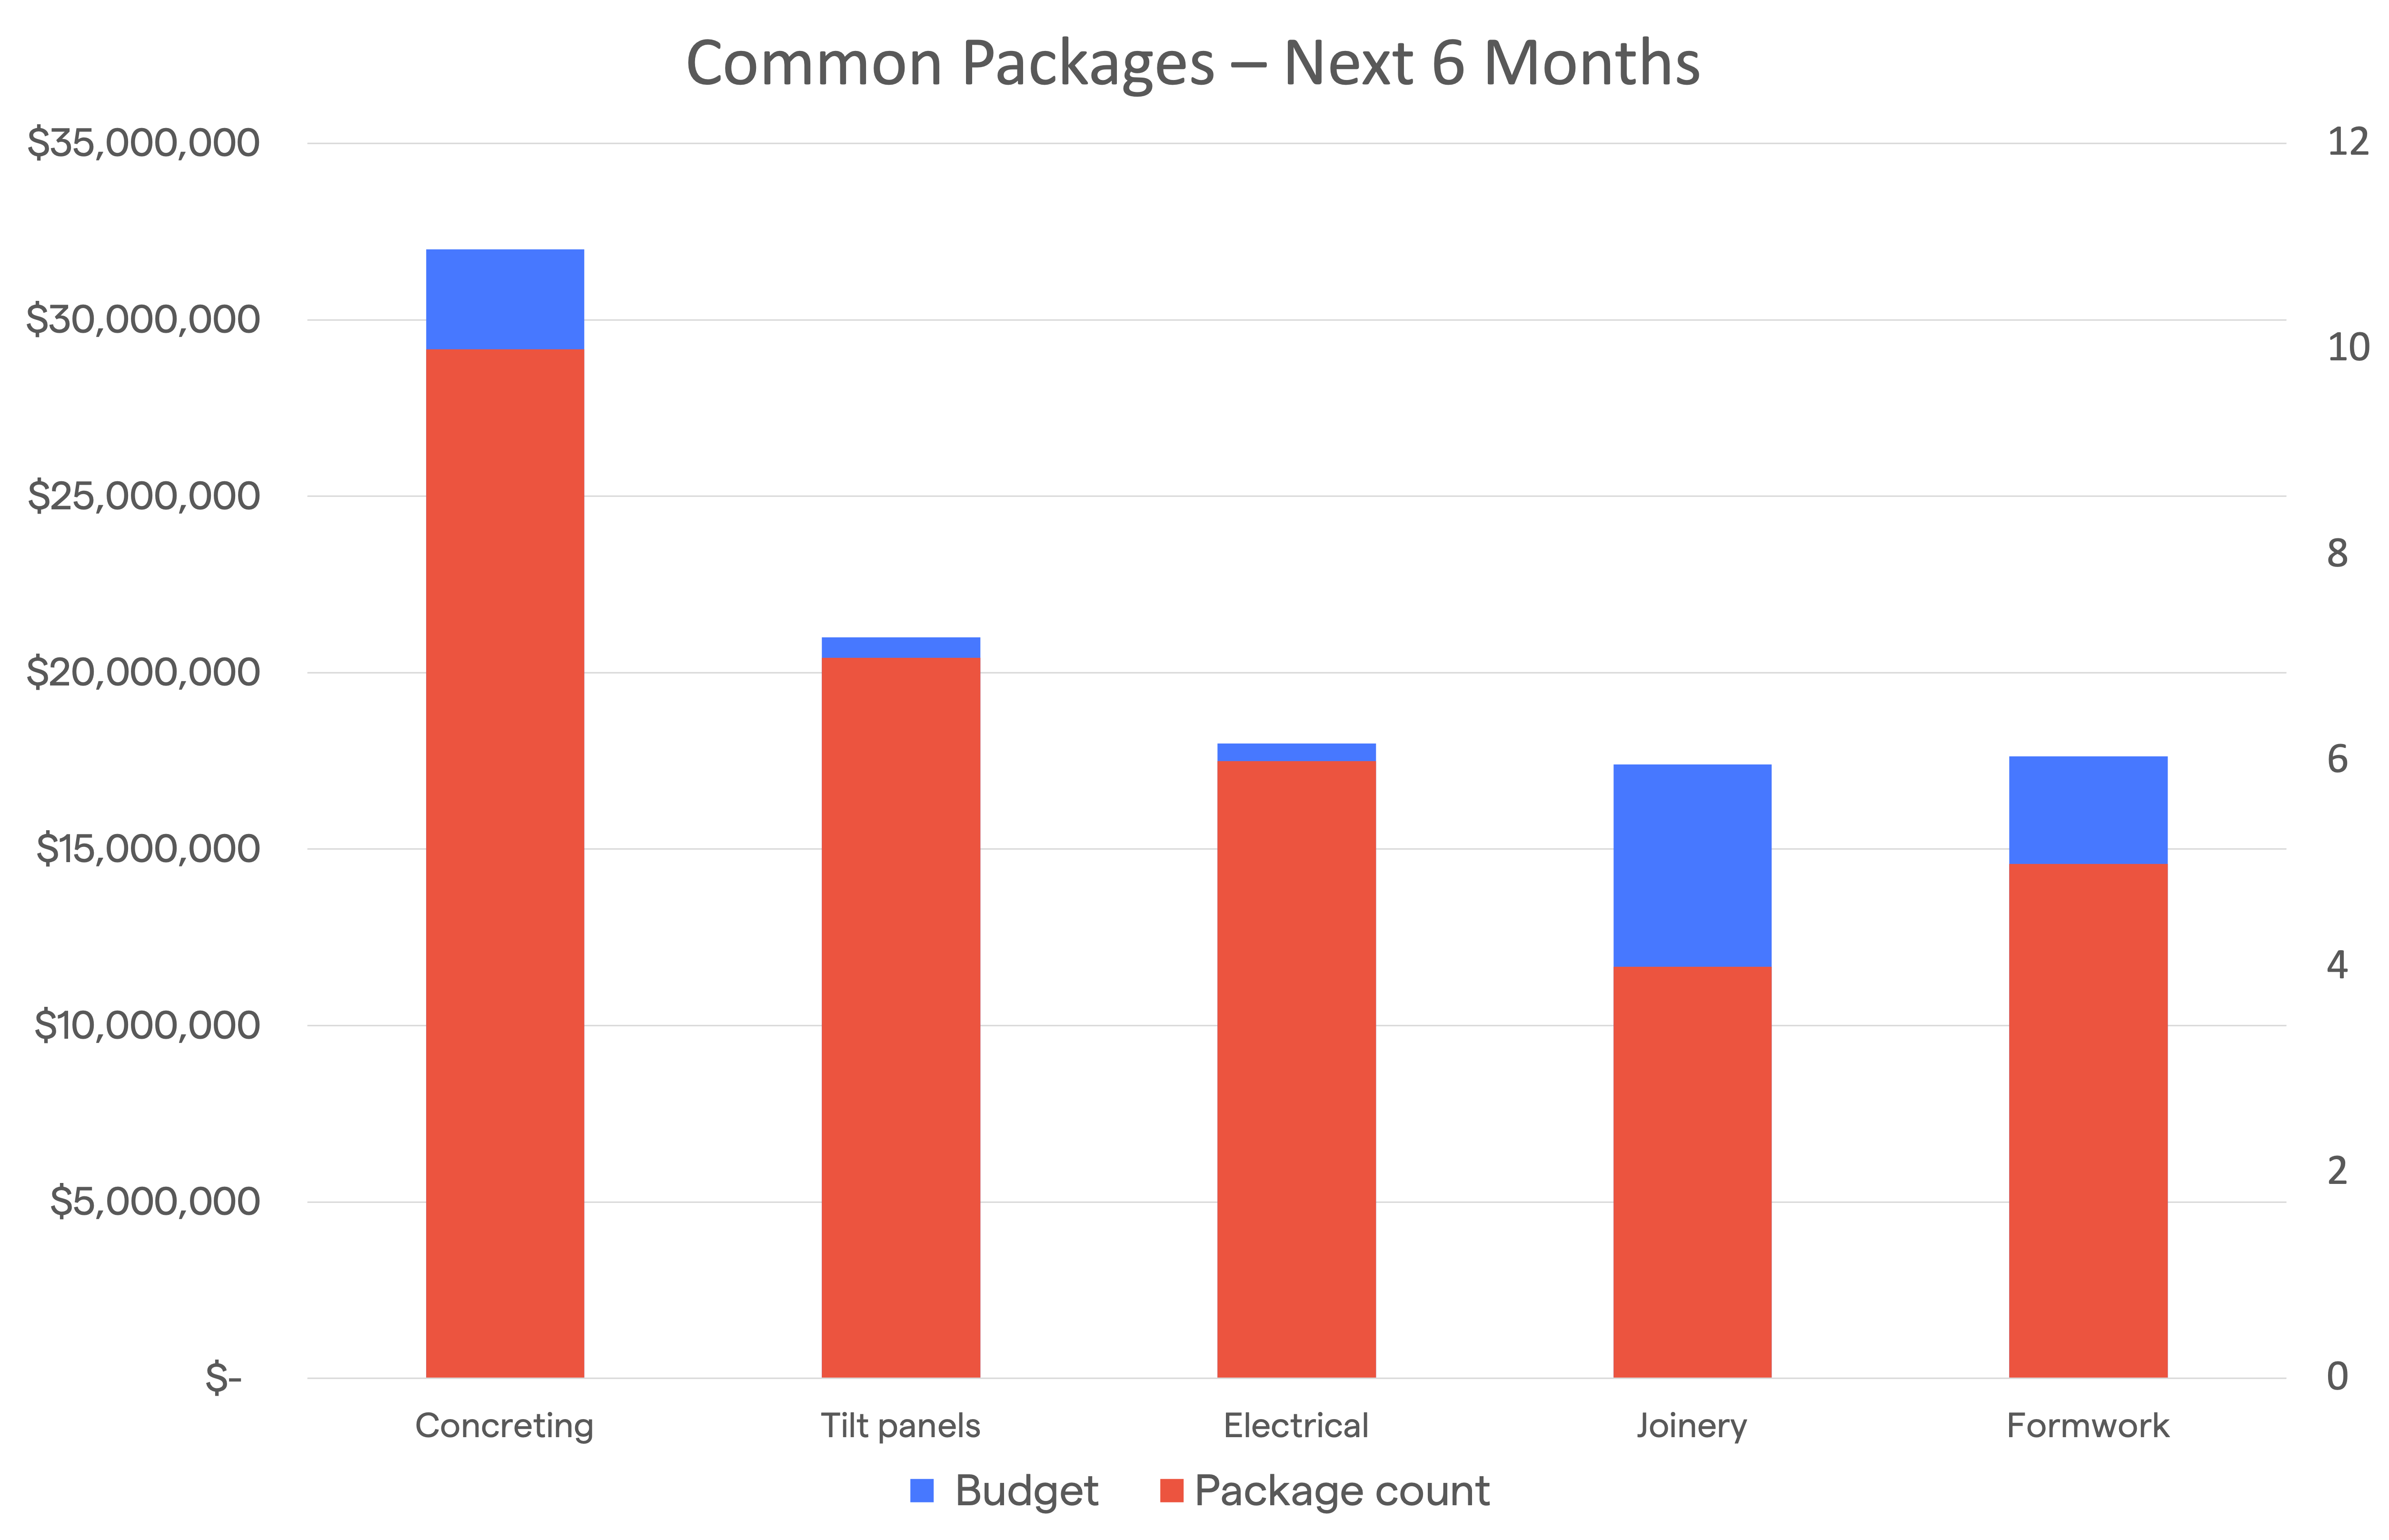
- Common procurement length (by business unit, project or item)
Analysing overall vendor spend: CFO, CPO, Finance, Commercial
Purpose: help with budget planning, optimise financial performance, analyse ROI / cost savings / cost avoidance, help with statutory reporting/compliance
- Spend by category/contract type (e.g. labour hire, major works)
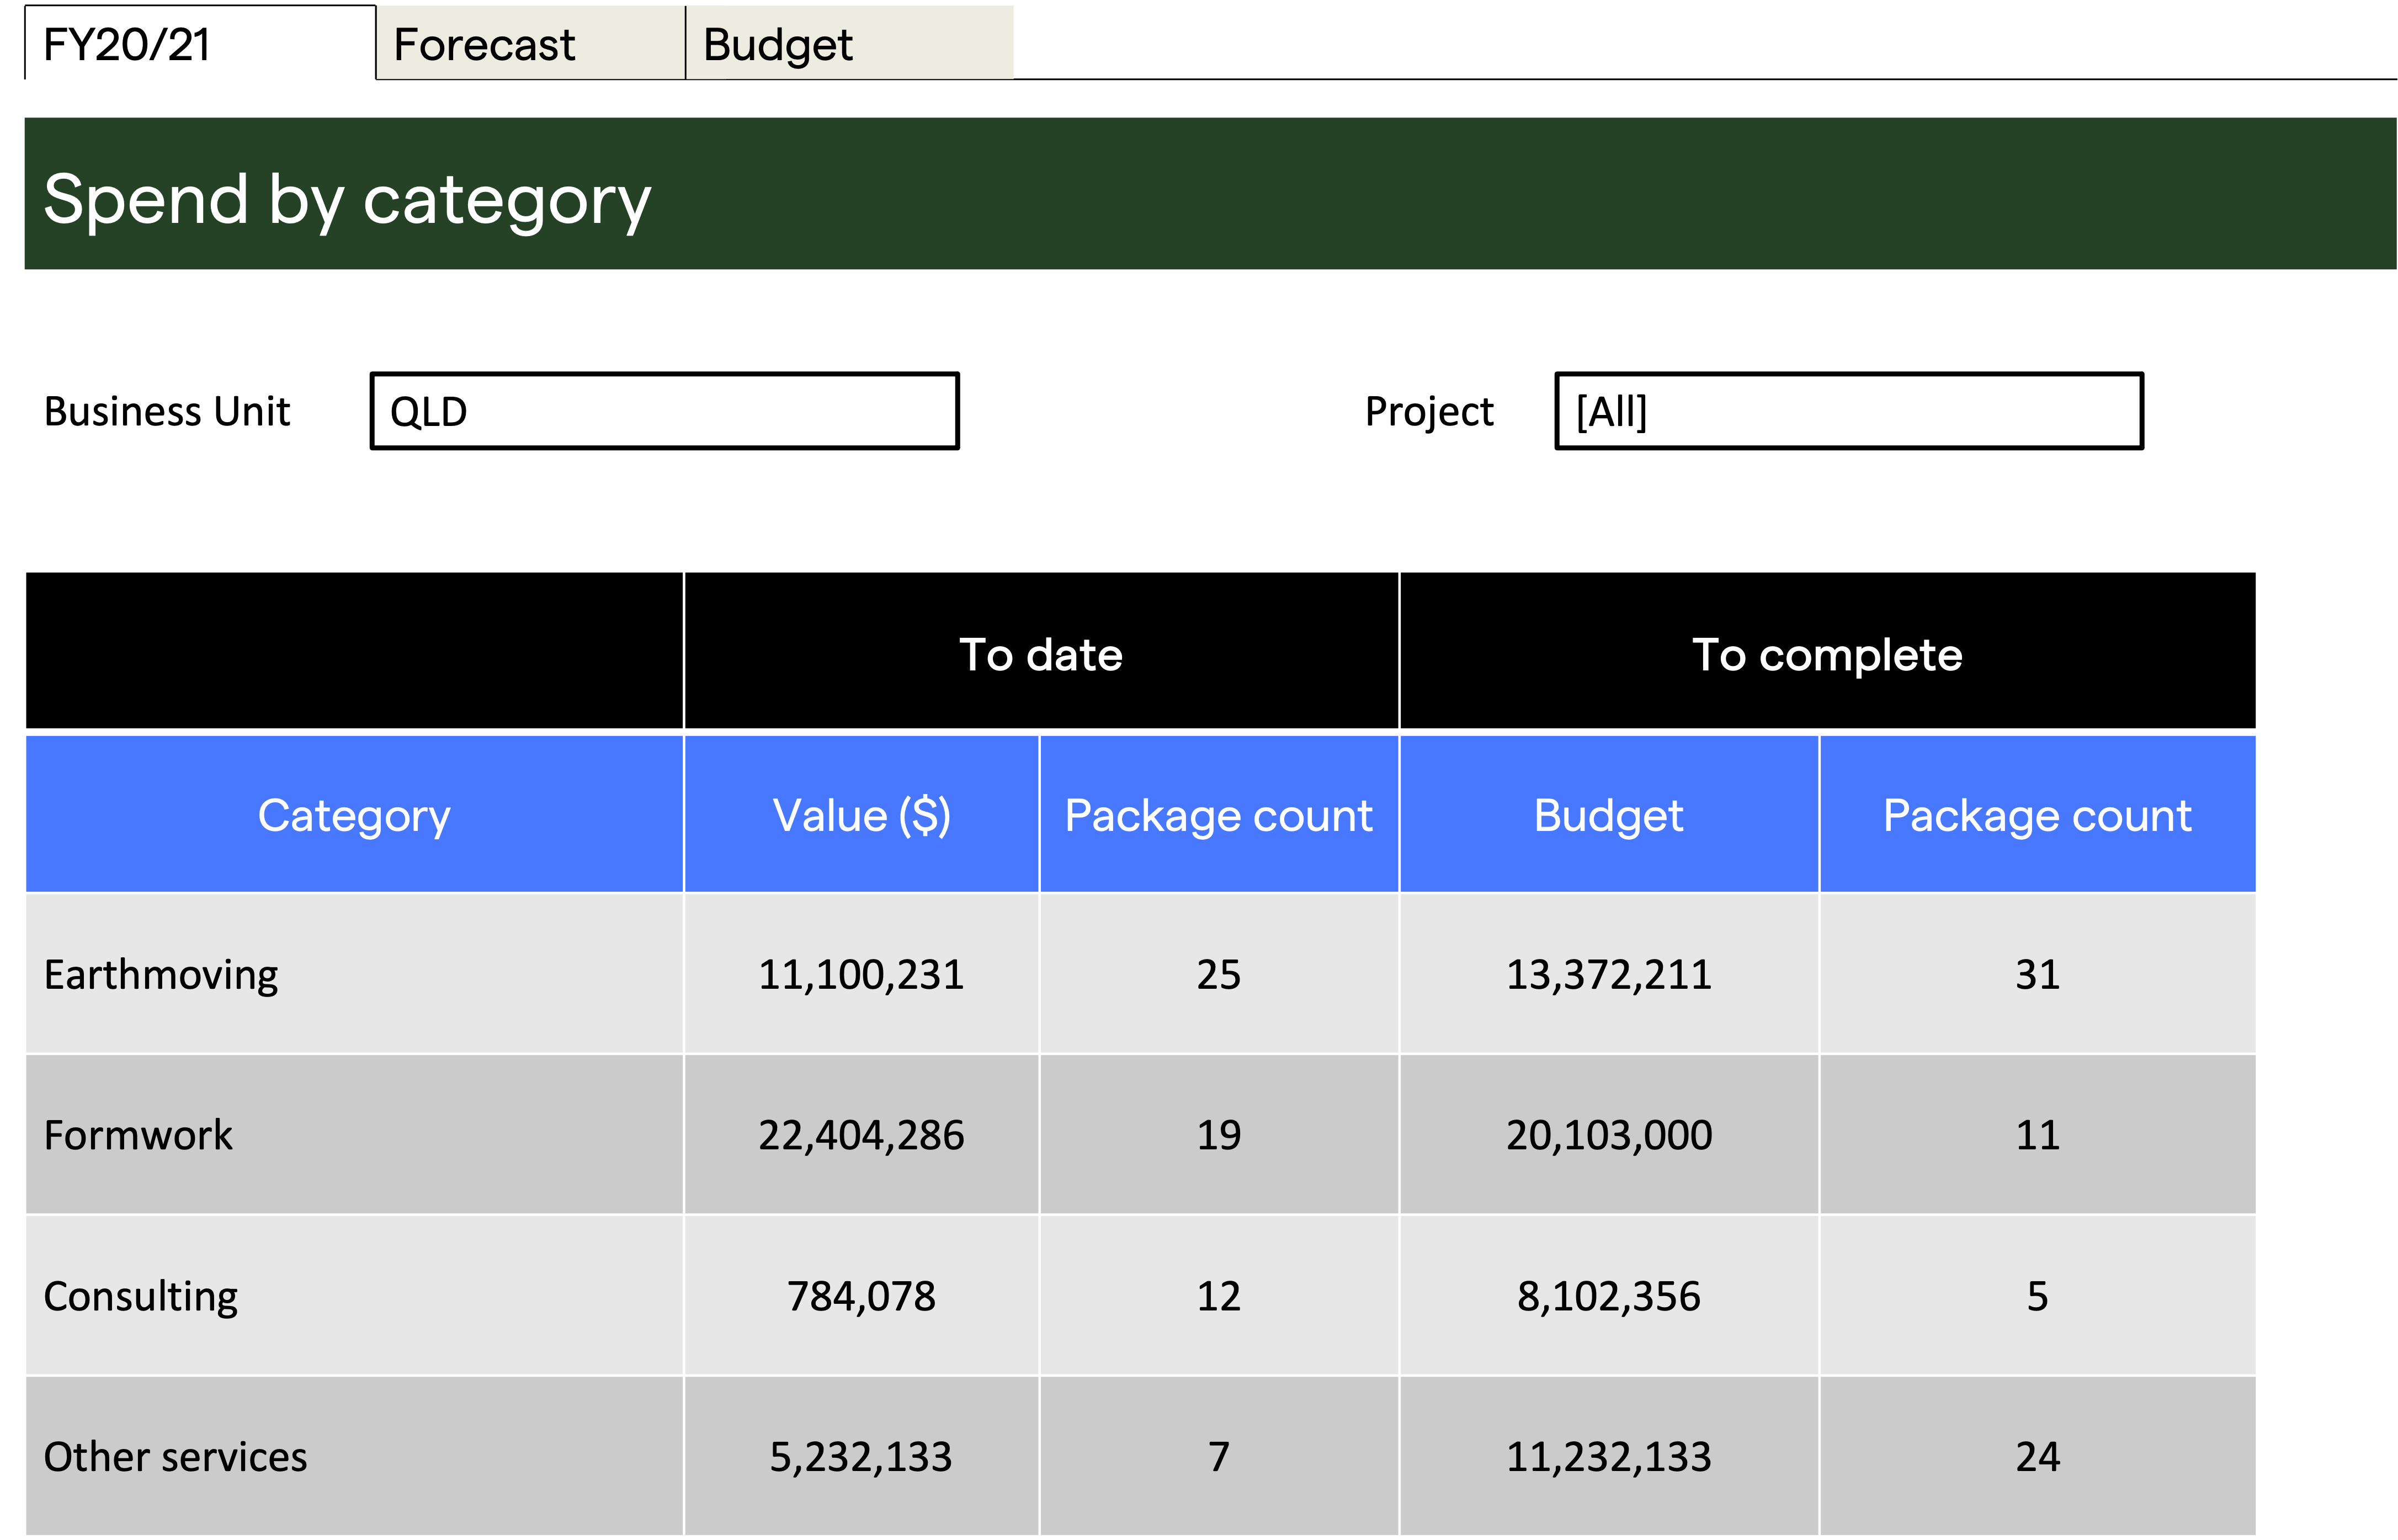
- Spend by strategic driver (e.g. strategic, transactional, local)
- Top categories by budget
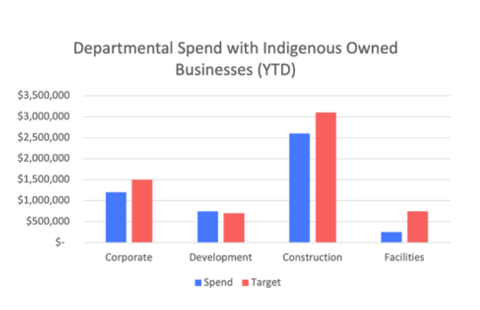
- Spend by vendor (overall) or by vendor with certain characteristics (e.g. Indigenous owned, social enterprises)
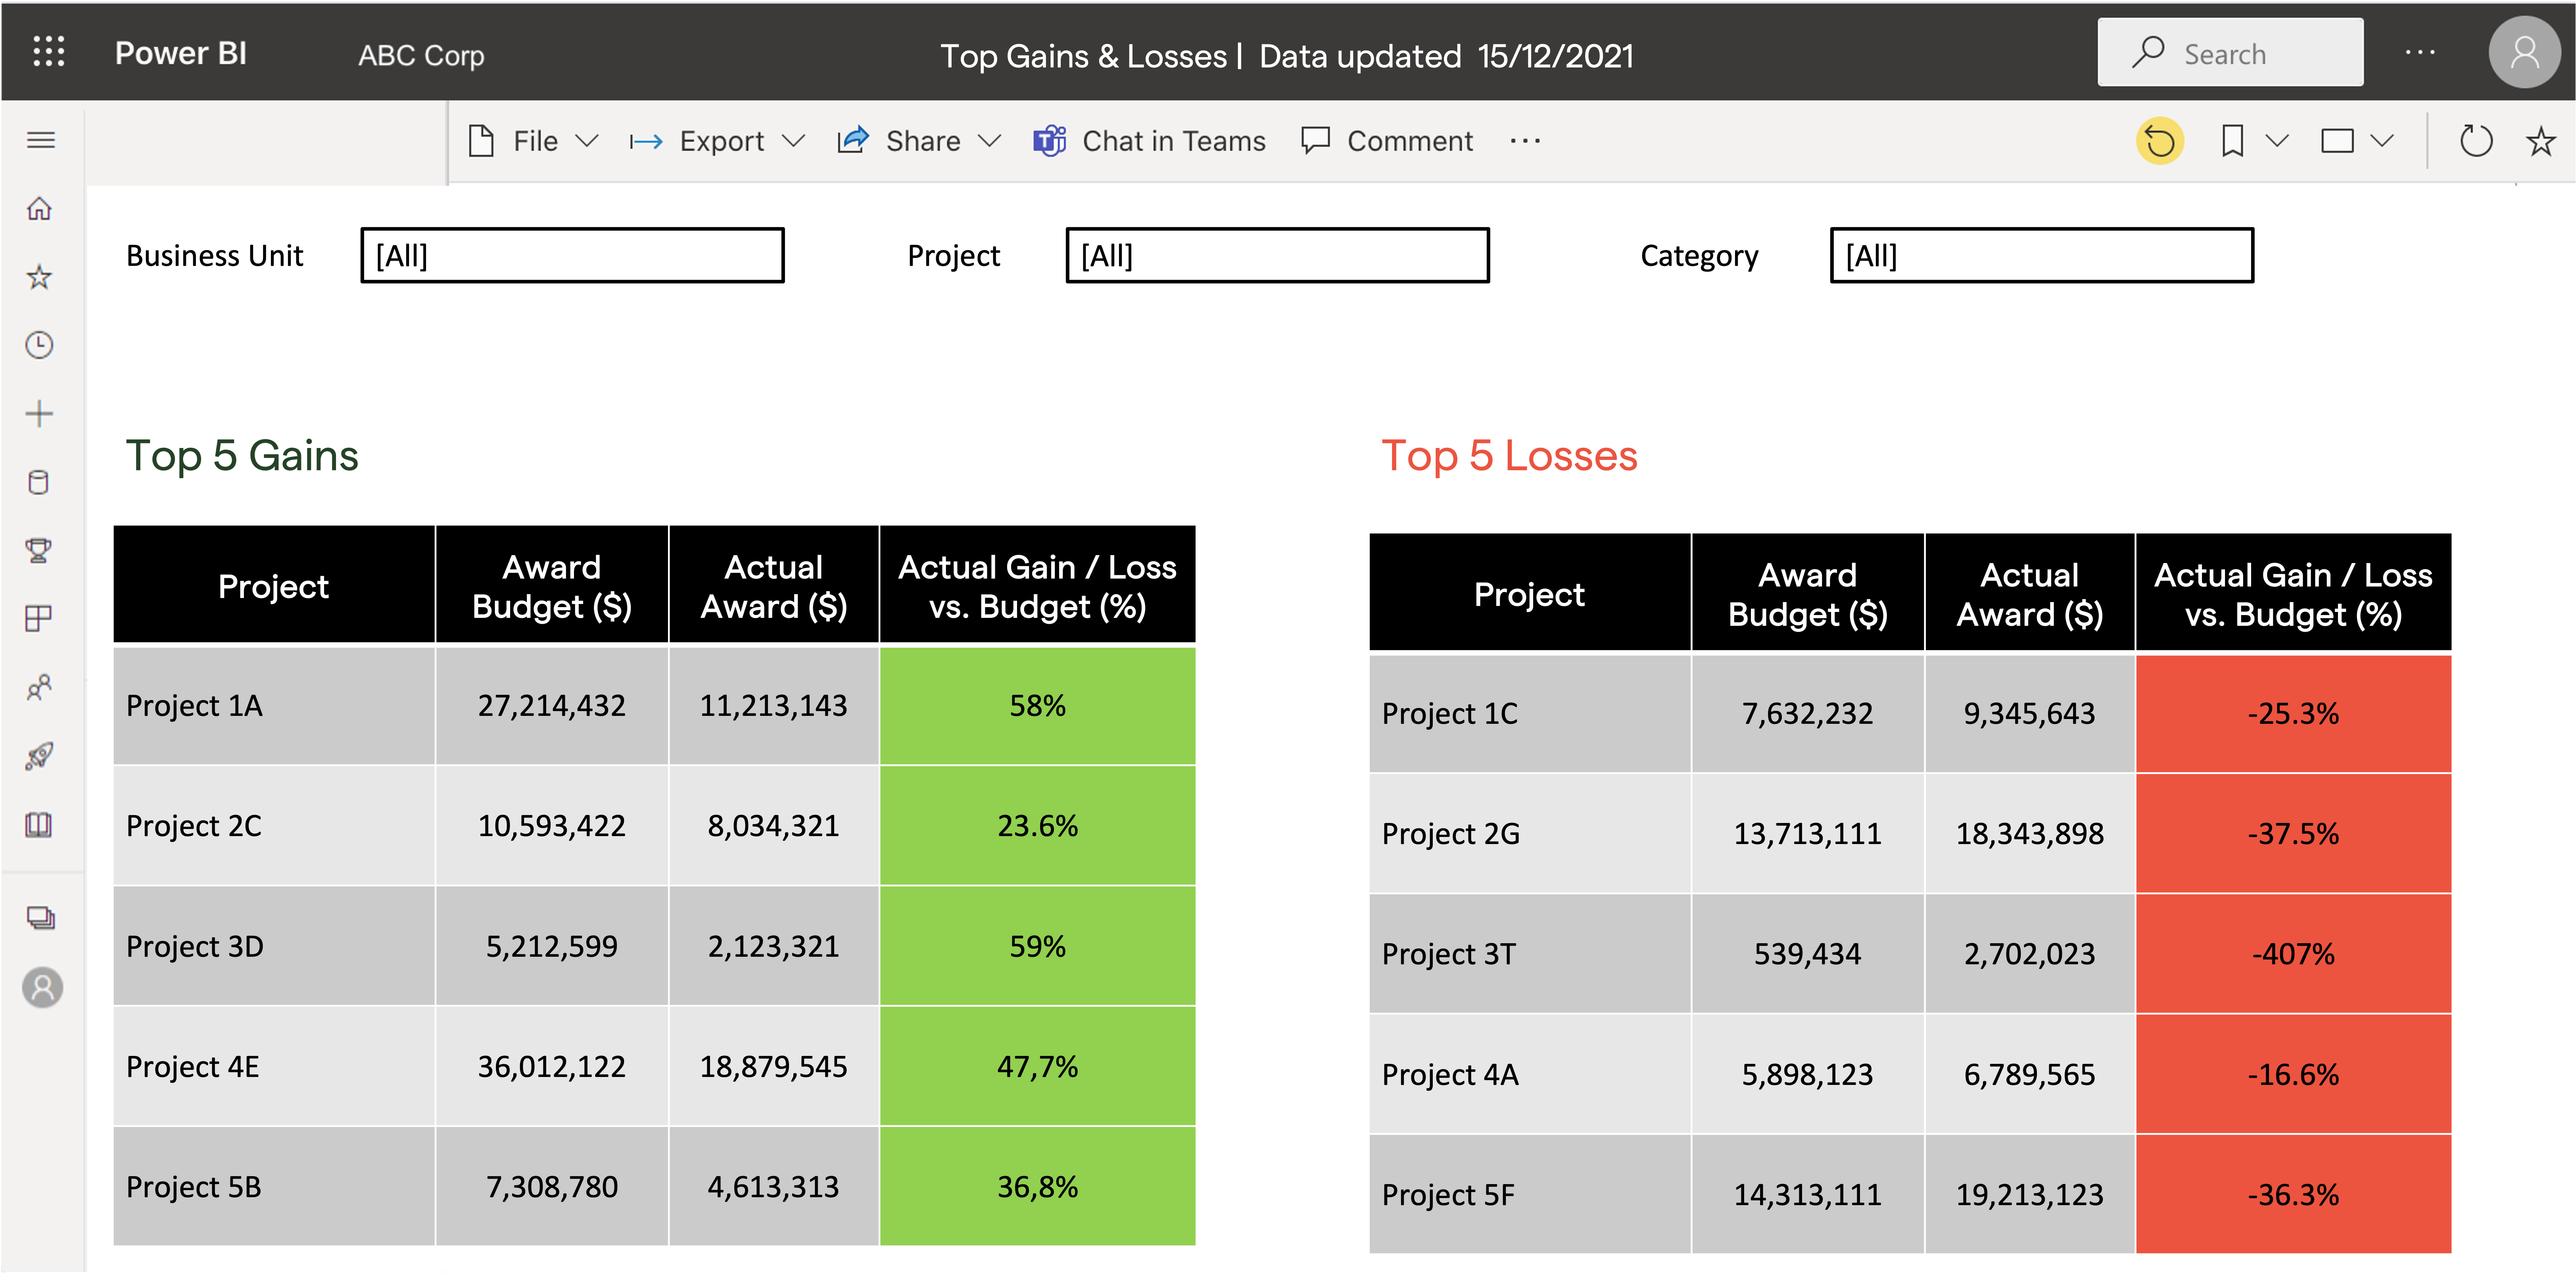
- Top 5 (or 10) wins and losses by budget vs actual across all projects
- Procurement ROI (annual wins or cost savings vs. procurement cost)
- Maverick spend (gap between actual spend and captured spend)
Vendor management dashboard: CPO, Procurement, GRC
Taking a lifecycle approach to vendor management means constantly analysing experience to ensure lessons are learned and shared.
The train doesn’t stop at awarding a contract. Central procurement and governance risk compliance (GRC) teams can build reports and dashboards to keep building the knowledge of their supply chain.
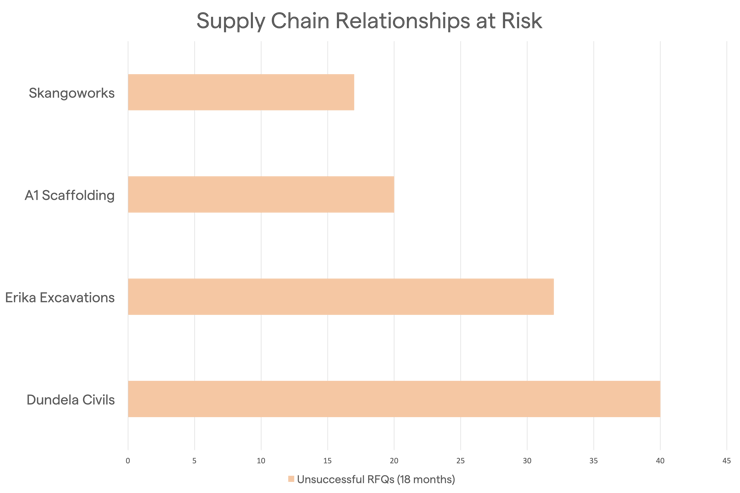
Vendor relationship management/ Identify at-risk suppliers:
- Vendor performance scorecard and ranking
- Supply chain relationships at risk (e.g. vendors with highest numbers of unsuccessful tender submissions)
- Upcoming contract renewal
- Contract deviation count by vendor
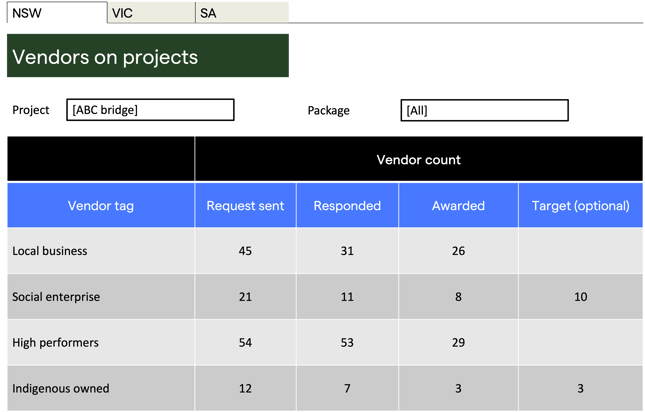
Diversify vendor pool:
- Vendor tags by projects/packages (e.g. local, high performers)
- Most active vendors across projects (capacity planning)
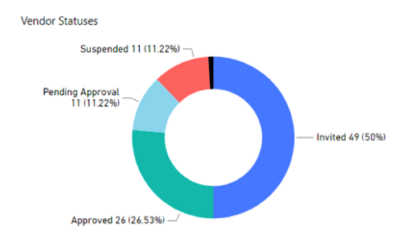
Track vendor/ subcontractor compliance:
- Vendor statuses (e.g. approved, suspended)
- Requalification due dates
Category management/ Identify contract savings opportunities:
- Schedule of rates historical data
- Vendor pool growth vs. vendor engagement/activity rate
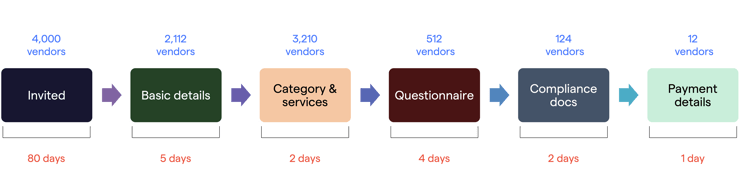
Internal efficiency/ productivity improvement:
- Vendor onboarding length + broken down by each step
- Longest approval time by approver
How Felix can help with data driven procurement
By having a centralised source of truth about your vendors, the possibilities are endless when it comes to slicing and dicing data.
The more technology is implemented across different stages of the vendor lifecycle, the more data points you’ll have to garner insights from. For instance, if you have Vendor Management, Procurement Schedule, Sourcing and Contracts, data can seamlessly flow between the modules, minimising the need to reconcile or clean data before analysis.
Start by exporting data from Felix manually or via our API into procurement analytics tools such as PowerBI, Tableau and Looker. You can also pull data from other systems (e.g. ERP) to enrich the analysis. Then build your own dashboards using data visualisation techniques and voilà, the stats begin to tell stories.
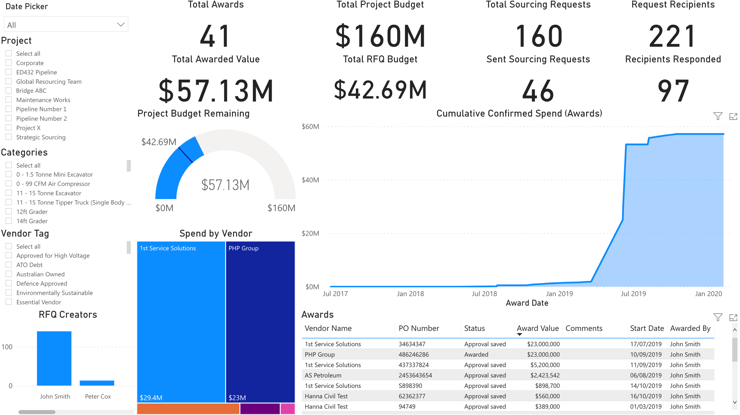
An example dashboard to show sourcing activities
As always, feel free to reach out if you'd like to see how we can help uncover procurement analytics opportunities.


Recent Articles

How to approach procurement risk management effectively
Most procurement teams already know their supplier base carries risk. The harder question is what to do about it without doubling the admin load. Insurances lapse mid-engagement. A subcontractor who underperformed on one project gets re-engaged on the next because nobody flagged it. Compliance documents sit in inboxes, on shared drives, in someone's head.
.png)
How Felix’s strategic sourcing module brings clarity to tendering
Tendering often breaks down into a manual, fragmented process. Specifications are sent by email, vendor questions are answered inconsistently, and bids arrive in different formats, making bid evaluation slow and difficult. By the time a Recommendation for Award is submitted, the audit trail is scattered across inboxes, shared drives and individual recollections. Strategic sourcing software helps procurement teams standardise tendering, improve governance and create a clearer path to award.

Building Brisbane, building the future: Reflections from FCON26
Last week I had the chance to attend FCON26 – the 6th annual Future of Construction Summit – held at the Royal International Convention Centre in Brisbane. Over two days, more than 1,000 construction industry professionals gathered to talk strategy, technology and the future of how Australia delivers.